Google Analytics provides various reports that provide valuable insights into websites and visitors. But these reports are very much basic in nature and don’t usually provide insights that you need to analyse your website performance and its contribution to the marketing key objectives.
This is where custom reports come into the picture. Google Analytics allows you to customize and build your own reports from scratch that allows you to gain valuable insights about your visitors and use it to improve their experience and achieve your targets.
How to create Google Analytics Custom Reports?
Although you can find all the essential user-defined custom reports, advanced dimensions, goals, and dashboards at Google Solutions Gallery, you should know how custom reports are configured so that you can optimize according to your requirements.
To find custom reports in your Google Analytics account click on Customization >> Custom Reports

Next, click on the + New Custom Report button

Now, give a title to your custom report and then to the report tab. Each custom report can have multiple report tabs which are very useful in case you want to see multiple reports related to each other under one custom report.

Afterwards, choose a relevant report type among the following three types –
- Explorer- This is the standard Google Analytics report. It includes a line graph and a data table below.
- Flat Table- This a static and a sortable table that shows data in rows. It is one of the most common types of custom reports used by marketers for the obvious reason – it’s simple and easy to analyse.
- Map Overlay- This is simply a map of the world including regions and countries in darker colours when there is traffic or site engagement.
Now comes the most important part of the custom report that defines the report and its use. You have to define the metrics and dimension of the report. The metric you define will be included in the report against the dimensions you choose as shown below-

The last step is to add filters to your custom report if required. Filters allow you to include or exclude the data that appears in the report.
Finally, click Save and your custom report is created and the out will appear on your screen.
Google Analytics Custom Reports for B2B websites
Now, you know how to create custom reports but before creating any custom report, you must have a clear idea of what you want to determine from the report and choose the metrics and dimensions accordingly.
In the B2B space, a website plays a vital role throughout the marketing funnel from creating brand awareness to lead conversion. This is why analysing the website and optimising it for better performance is very critical for B2B marketing.
Going further, I will walk you through 9 Google Analytics Custom Reports which are very essential for B2B marketing and lead generation.
1. Traffic reports by day of the week name and hours
In B2B space, it is very important to understand the traffic behaviour on the website by time so that you can determine the best day and time when people visit your website most.
Using this report, you analyze if the weekdays and working hours are the best time to engage your audience or during weekends and after work. If you narrow the report further, you can even figure out the specific time and day when your audience is more active.
Basically, with this report, you will be able to create effective marketing campaigns across multiple channels when your target audiences are more likely to search on Google or engage on a website.
Here’s how this report is configured –

2. Visitor Acquisition Efficiency Report
If you are running paid campaigns on search engines and social channels to attract prospects to your website, this report can help you analyse the efficiency and contribution of each campaign in driving traffic to your website.
In this report, the dimensions are drilled down from the traffic source to the campaign and then to the city (country, if targeting the global market) which allows you to see which campaign on which platform is driving traffic to your website and where are those visitors located geographically.
Here’s how the report looks like-

3. Content Performance Analysis Report
B2B websites are usually the information source for customers and prospects and that’s what helps marketers to generate leads for the business. So, it is very important to analyse the performance of blogs or pages in terms of engagement and conversion.
In this report, you should add all the metrics that you need to analyse the performance of your website content. The metrics like goal conversion rate, entrance/page views, avg time on page, etc. are very critical to the report.

In the above, you will notice that the dimension in the report is drilled down in the following order Page title> User type > Source/Medium > Campaign. With this report, you will be able to gather insights that can help you understand what type of content your visitors are more interested in, which content attracts new visitors and old visitors and the source of the traffic.
4. Internal Site Search Report
In this report, you can analyse how visitors engage with the search box on your site. Using this report, you will be able to see the terms visitors are searching for on the site and how they are with the results.
For example, if the visitors are searching for certain terms and are leaving the site right after that then it shows that they couldn’t find the information they seek. Using this insight you can create content that can help you keep the visitors longer and increase the probability of conversion.

Similarly, by combining other dimensions and metrics from this report, you can figure out what kind of information they are looking for on your website and then optimize the content strategy accordingly for better results.
5. PPC campaign report
Running Google Search Ads for your business? That’s great!
But do you know how these ad campaigns are contributing to achieving your business goals? Well, this report can help you analyse other aspects of ads that you might not find in the campaign manager reports.
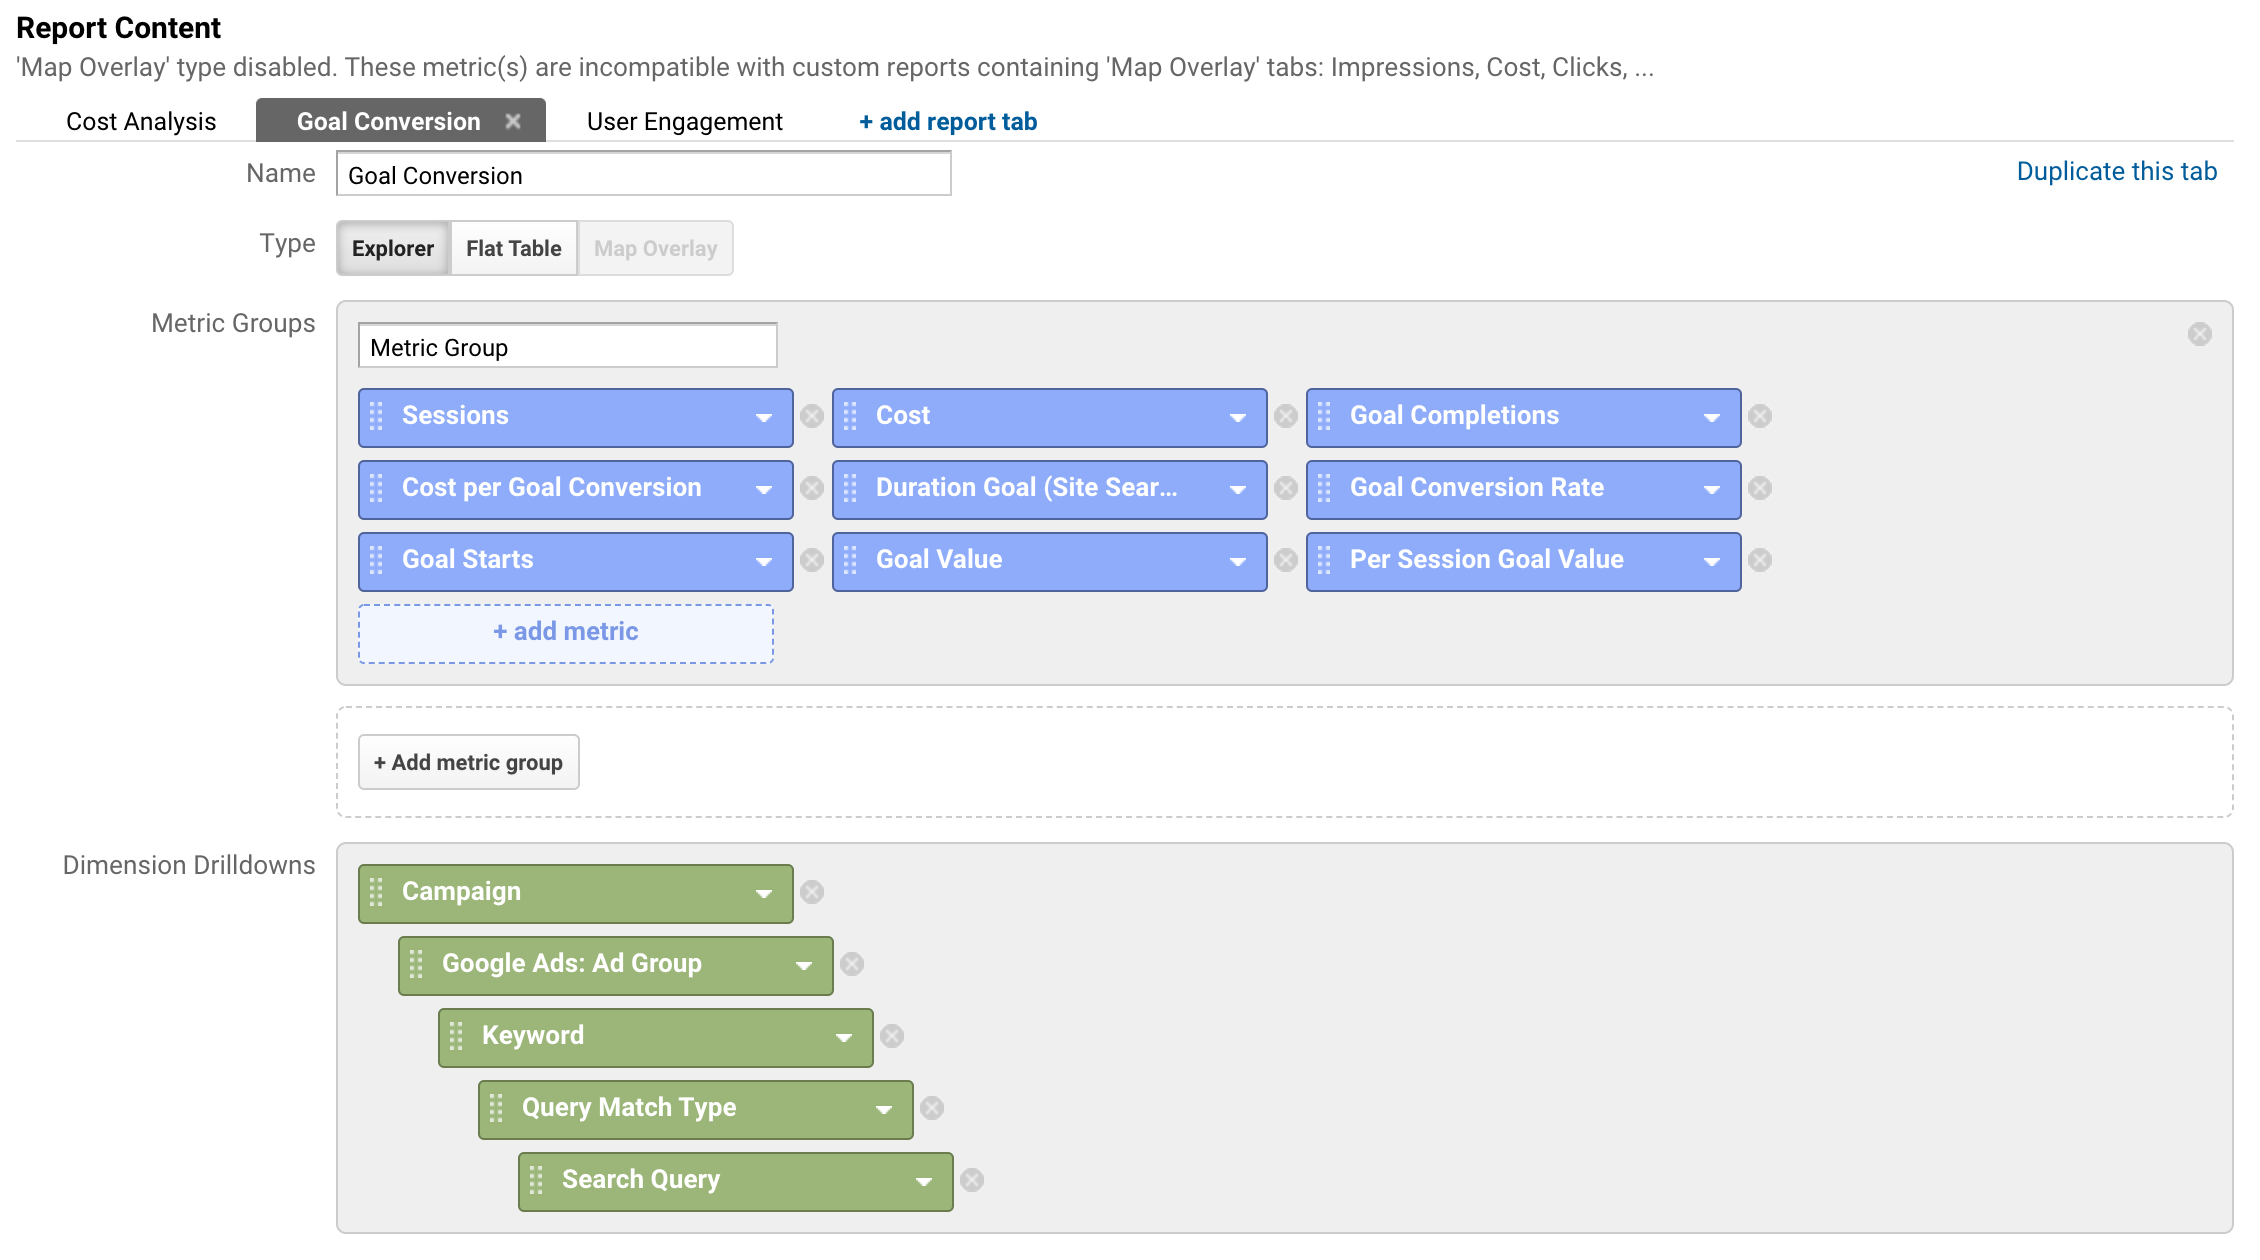
This report includes 3 tabs Cost Analysis, Goal Conversion and User Engagement.
Cost Analysis Report – In this report, you’ll find data related to the amount spent on the campaign and the cost of outcomes like CPC, CPM, CTR, etc. You can find these data in the Ad report as well but what’s better than having all the information in one place, right?

Goal Conversion Report- In this report, you’ll be able to analyse the performance of your campaigns in goal completion and conversion. The metrics like Goal started, Goal conversion rate etc gives you insight into whether the traffic generated via ads is actually converting to your website goals or not.

User Engagement- Your campaigns might be driving traffic to your website but what is important to see is if they are engaging on your website. The metrics like avg session duration, pageviews, pages per session, etc. for each campaign can help you visualise which campaign is driving the most engaging visitors to your website.

6. Social Media Traffic Analysis Report
Social media might be playing a very crucial role in driving traffic to your website. If so, you need to know which page or content is getting traffic from which social channel and most importantly, the quality of visitors these platforms drive to the site.

By analysing the metrics like pageviews, avg session duration, time on page, etc., you’ll be able to see if the traffic generated from social channels are relevant to your business or not. If they are relevant but aren’t engaging much, you need to figure out the issue and optimise your social media marketing strategy.
7. Event Interaction Report
Till now, you must have realised how important it is to understand the interaction behaviour on your website to ensure that the prospects can be moved forward to the conversion and other website goals.
Event Interaction Report is quite similar to the built-in event report and this custom report is in a flat table format which makes it easier for you to analyse which event is triggered the most and how frequently it is used.
You can also use this report to analyse the results of A/B testing of forms and CTAs on landing pages. Here’s how the report is configured –

8. Goal analysis by traffic source
In this report, you’ll be able to analyse which traffic source/medium contributes the most in goal completion and conversion. Using the insights from this report, you can determine which platform needs your attention and which is performing well in terms of attracting quality traffic.

9. Long Tail Keyword Analysis Report
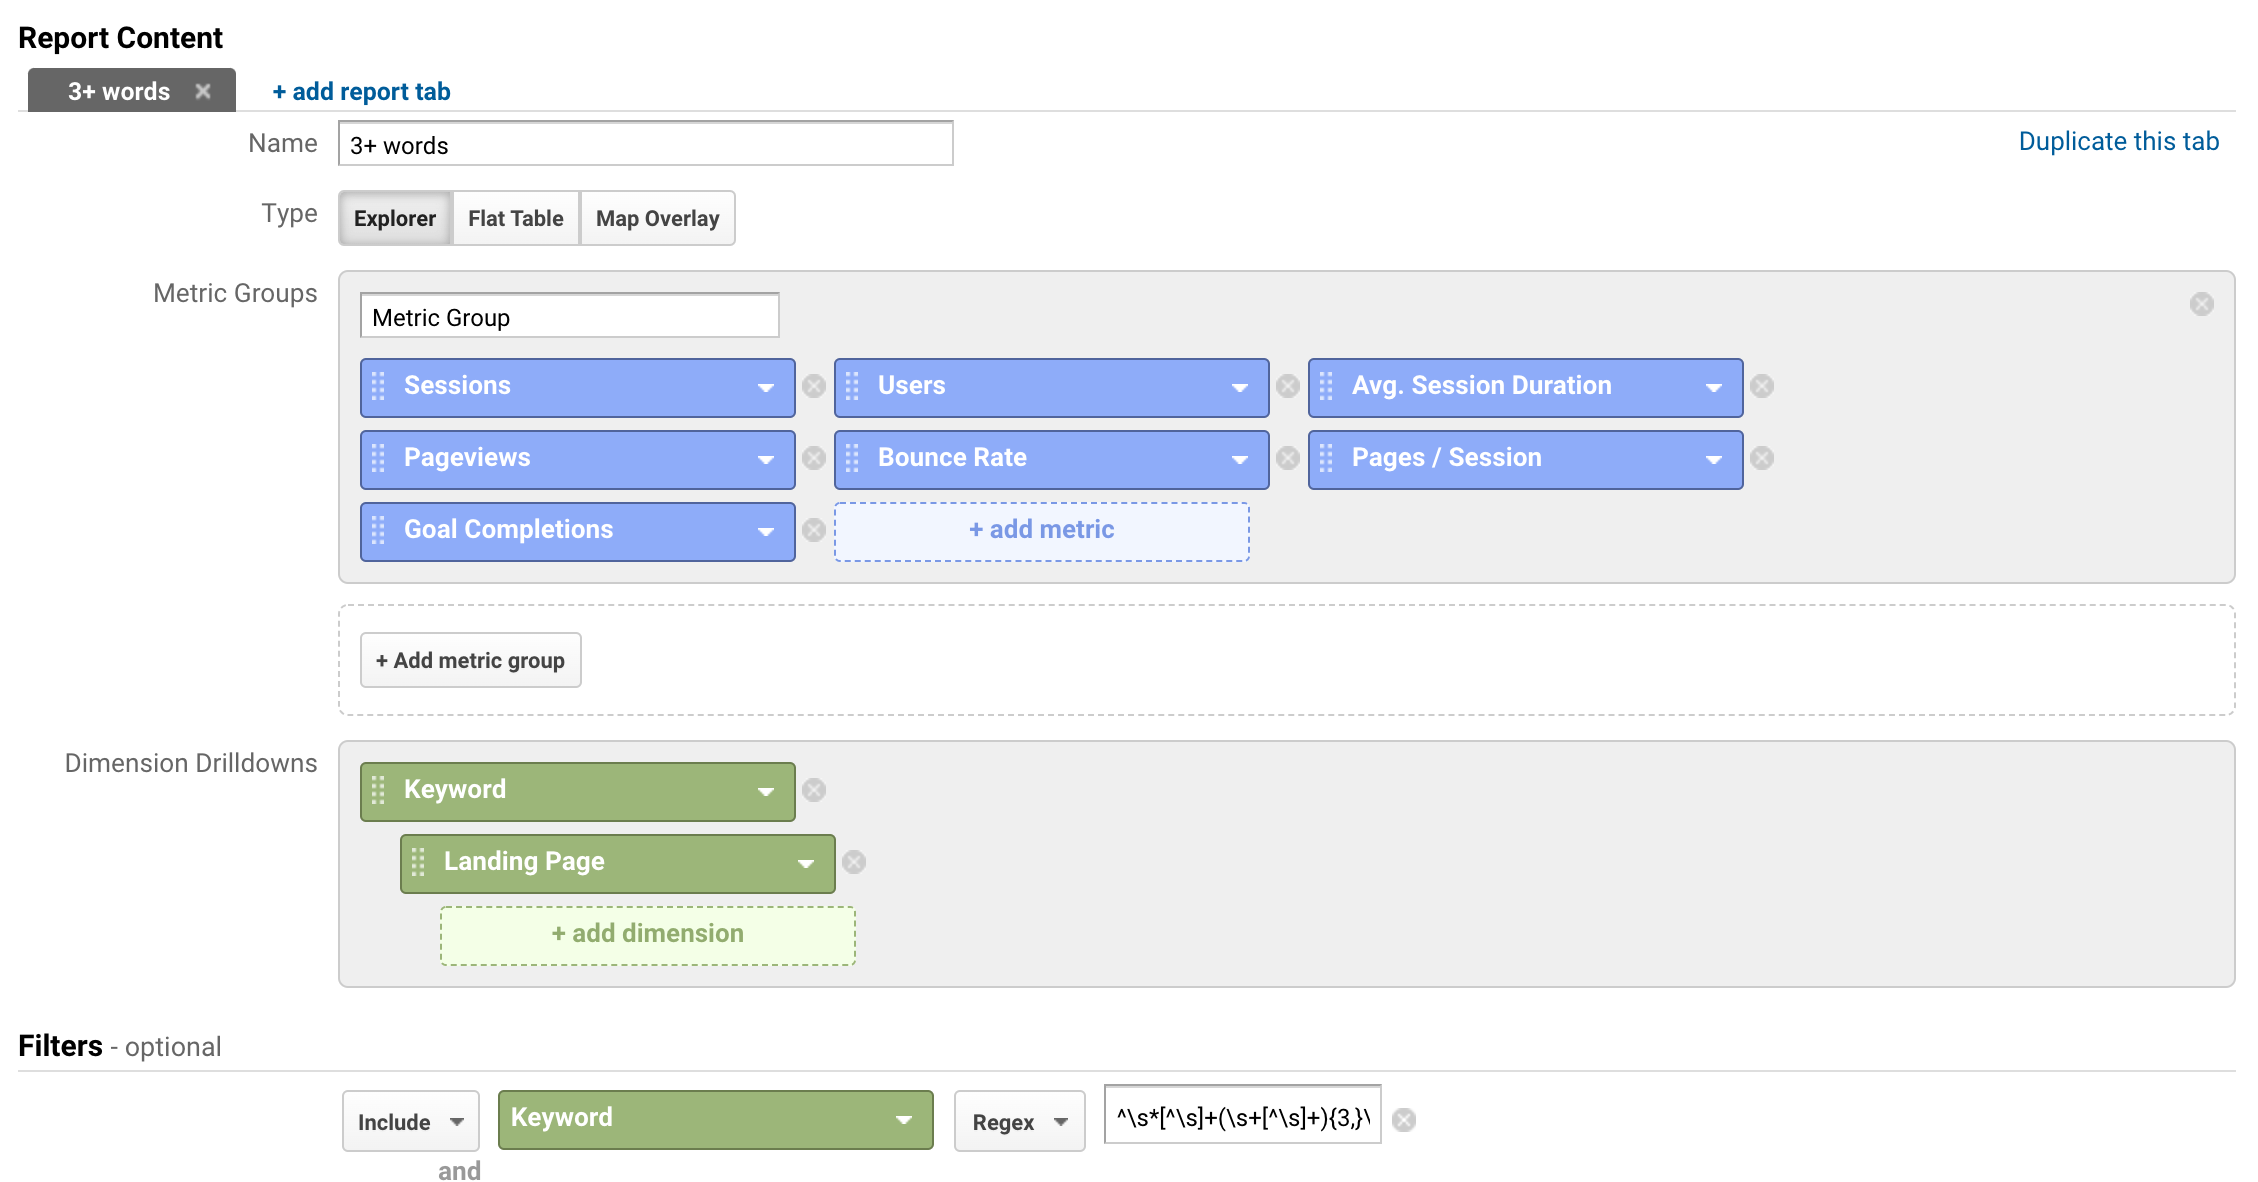
Even though Google Analytics stopped showing organic keywords, this report is very important to analyse the paid long-tail keywords that are driving traffic to your website.

Using this report you can find relevant 3+ word keywords for which you are paying right now but can include these keywords in your SEO strategy to boost your rank for these keywords to rank organically. This way, you’ll be able to generate leads while the campaigns are inactive.
Wrapping Up
Google Analytics Reports provides you with overall insights about your website but by using these reports, you hardly come up with conclusive insights about your visitors, website content performance, etc. This is why you must leverage custom reports to get only data that matters for your business.
You can easily download these reports from Google Solution Gallery but being able to personalise a report as per your requirements puts you at advantage over others in customer behaviour analysis.
I suggest that instead of downloading the reports directly, refer to the images attached above and configure your own custom reports.
